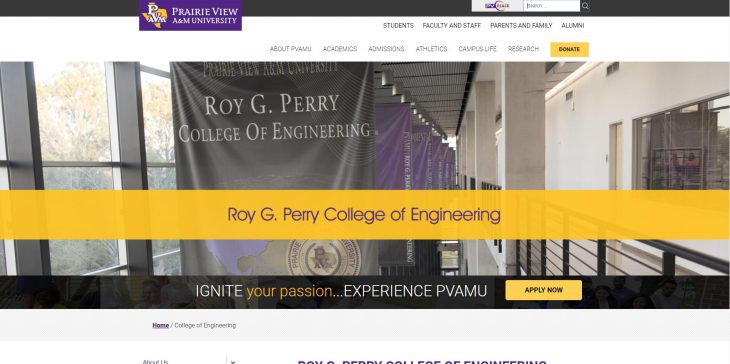
The College of Engineering at Prairie View A&M University
EDU
April 29, 2018
Engineering School Admissions
Application
| Director of admissions |
Dr. Kendall Harris |
| Application deadline (U.S. residents) |
July 1 |
| Application fee (U.S. residents) |
$50 |
| Application deadline (international students) |
July 1 |
| Application fee (international students) |
$50 |

Admissions Statistics
| Total applicants (master’s and Ph.D.) |
43 |
| Total acceptances (master’s and Ph.D.) |
42 |
| Overall acceptance rate |
97.7% – High |
Master’s Program Entering Class GPA and GRE Scores
| Average undergraduate GPA |
3.10 |
| Average GRE |
615 quantitative |
Doctoral Program Entering Class GPA and GRE Scores
| Average undergraduate GPA |
3.40 |
| Average GRE |
700 quantitative |
| TOEFL required for international students |
Yes |
| Minimum TOEFL score required |
500 paper test
0 internet-based test |
Department Contacts
Engineering School Academics
Enrollment
| Total graduate engineering enrollment |
125 |
| Master’s (full-time) |
60 |
| Master’s (part-time) |
50 |
| Ph.D. (full-time) |
15 |
| Ph.D. (part-time) |
0 |
Graduates (2011)
| Total graduates |
27 |
| Total master’s graduates |
25 |
| International master’s graduates |
56.0% |
| Minority master’s graduates |
28.0% |
| Female master’s graduates |
28.0% |
| Total Ph.D. graduates |
2 |
| International Ph.D. graduates |
50.0% |
| Minority Ph.D. graduates |
0.0% |
| Female Ph.D. graduates |
0.0% |
Programs
100.0 percent of students reported specialty information. Totals may exceed 100% due to students with multiple specialities.
| Program |
Faculty |
Student Specialization |
| Architectural |
0 |
N/A |
| Chemical |
0 |
N/A |
| Civil |
0 |
N/A |
| Computer engineering |
0 |
N/A |
| Computer science |
6 |
31.2% |
| Electrical |
8 |
30.4% |
| Mechanical |
0 |
N/A |
| Other |
7 |
38.4% |
|
Faculty (2011-2012)
| Full-time faculty |
20 |
| Part-time faculty |
1 |
| Full-time faculty elected to the National Academy of Engineering |
0 |
Research (2010-2011)
| Engineering school research expenditures (2010-2011 fiscal year) |
N/A |
| Full-time faculty engaged in engineering-related research during 2010-2011 academic year |
N/A |
Engineering School Ranking
| Rank Not Published |
Best Engineering Schools |
|
Engineering Ranking Scores
| Score |
N/A |
| Peer assessment score (out of 5) |
1.6 |
| Recruiter assessment score (out of 5) |
1.8 |
| Overall acceptance rate |
97.7% – High |
| Average GRE quantitative score (master’s and Ph.D. students) |
627 |
| Ph.D. student/faculty ratio |
0.8:1 – Low |
| Ph.D.s granted |
2 |
| Engineering school research expenditures (2010-2011 fiscal year) |
N/A |
| Research expenditures per faculty member |
N/A |
| Faculty membership in National Academy of Engineering |
0.0% |
| Total graduate engineering enrollment |
125 |
Engineering School Student Body
Student Body (Overall)
| Total graduate engineering enrollment |
125 |
Student Body (Full-time)
| Enrollment (full-time) |
75 |
| Minority students |
48.0% |
| International students |
49.3% |
Student Body (Part-time)
| Enrollment (part-time) |
50 |
| Minority students |
68.0% |
| International students |
20.0% |
Engineering School Cost
Financial Aid Contact Information
| Financial aid director |
Kelvin Francois |
| Financial aid phone |
(936) 261-1000 |
Expenses
| Tuition |
Full-time: $199 per credit (in-state)
Full-time: $511 per credit (out-of-state)
Part-time: $199 per credit (in-state)
Part-time: $511 per credit (out-of-state) |
| Required fees |
$1,747 per year |
| Room and board |
$8,321 |
| Books and supplies |
$600 |
| Miscellaneous expenses |
$2,000 |
Financial Aid Availability
| Fellowships |
N/A |
| Teaching assistants |
N/A |
| Research assistants |
N/A |
| Other appointments |
N/A |

