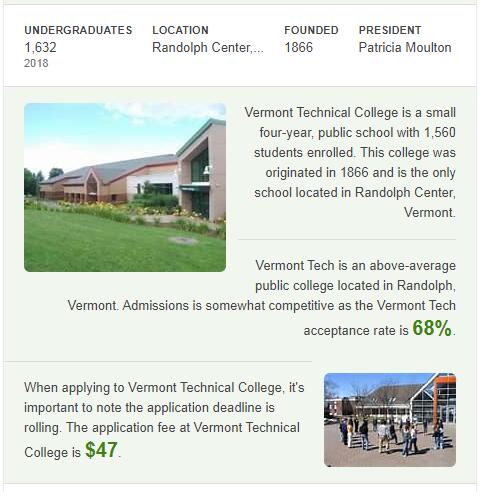
Located in Randolph Center, VT, Vermont Technical College is one of the best universities in the state of Vermont. On this page, you will find in-depth rankings for Vermont Technical College in the following areas: graduation rates, teaching resources, financing opportunities, and alumni donations. Latest acceptance rate is also given to show how competitive is Vermont Technical College.
PO Box 500 Randolph Center, VT 05061
Phone: (802) 728-1244
Email: admissions@vtc.edu
Web site: http://www.vtc.edu
Rankings: Vermont Technical College
| Rankings, Ratings, and Admissions Statistics | |
| Overall Ranking: | 22 |
| Score: | 29 |
| Peer college rating (out of 5) | 2.5 |
| Graduation and retention ranking: | 25 |
| Average freshman retention rate: | 68.8% |
| 6-year graduation rate: | 55.5% |
| Predicted graduation rate: | N/A |
| Overperformance(+)/Underperformance(-): | N/A |
| Faculty resources ranking: | 16 |
| Classes with under 20 students (2020): | 63.8% |
| Classes with 50 or more students (2020): | 0.3% |
| Student faculty ratio (2020): | 10:1 |
| Percent of faculty who are full-time (2020) | 61.3% |
| Student selectivity ranking: | 30 |
| SAT/ACT 25th-75th percentile (2020) | 863-1098 |
| 2020 Freshmen in top 10 percent of high school class: | 6% |
| Freshmen in top 25 percent of high school class (2020): | 21% |
| Fall 2020 Acceptance rate: | 62.4% |
| Financial resources rank: | 9 |
| Alumni giving rank: | 43 |
| Average alumni giving rate (2020): | N/A |

Essential Facts: Vermont Technical College
- Vermont Technical College is a small four-year, public school with 1,560 students enrolled. This college was originated in 1866 and is the only school located in Randolph Center, Vermont.
- Vermont Tech is an above-average public college located in Randolph, Vermont. Admissions is somewhat competitive as the Vermont Tech acceptance rate is 68%.
- When applying to Vermont Technical College, it’s important to note the application deadline is rolling. The application fee at Vermont Technical College is $47.
Rules and regulations Sports Activities
| General Information | |
| Percent of undergraduate students who live in college-owned, operated, or affiliated housing: | 55% |
| Percent of undergraduates who are members of a fraternity: | N/A |
| Percent of student body who are members of a sorority: | N/A |
| Average percentage of students on campus during weekends: | 35% |
| Are all students permitted to have cars on campus? | Yes |
| Percent of students who have cars on campus: | 75% |
| Is alcohol permitted on campus for students of legal age? | Yes |
| Additional policies and regulations: | class attendance policies set by individual instructors |
| Collegiate athletic association: | NAIA |
| Men’s scholarship sports: | N/A |
| Women’s scholarship sports: | N/A |
| Student activities: | drama/theater, radio station, student government, television station, yearbook |
